As a Habitica user, I once wanted to visually track my daily task (Dailies) completion. With the help of AI, I developed the Habitica Dailies Heatmap project and deployed it on my routine webpage.
Key Features of the Project
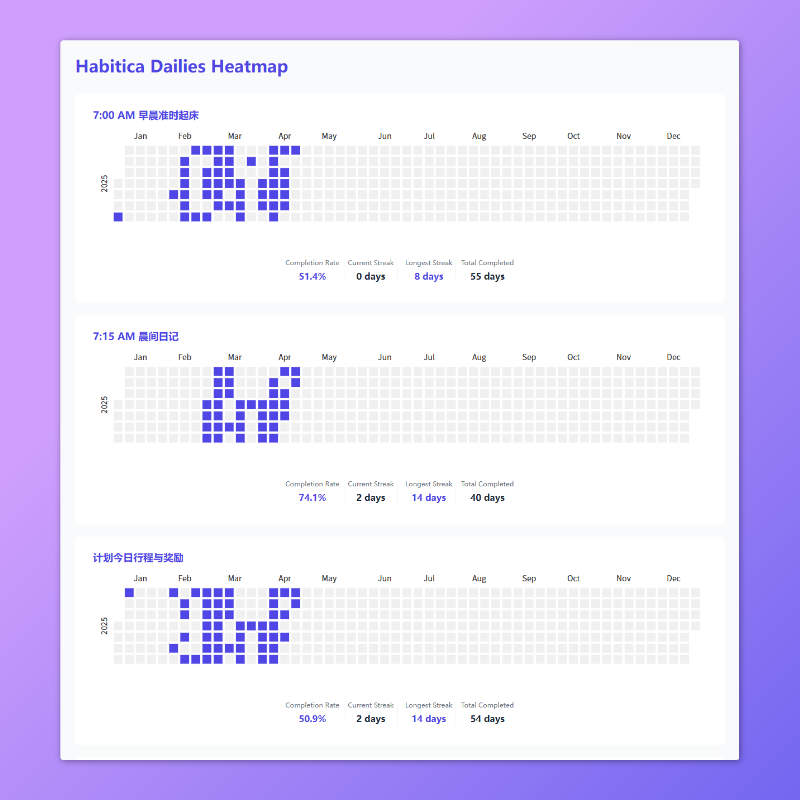
- Visualize Daily Completion: Clearly displays your daily task completion status over a period (usually a year) in chart form.
- Track Continuity and Habits: Helps users track habits, view continuity, and review completion history.
- Security: API credentials are used only in controlled environments and are not exposed to client browsers.
- Automation: Supports automated data retrieval, updates, and deployment processes through GitHub Actions.
How to Use
This project is open source. If you want to deploy your own Habitica Dailies Heatmap, you can fork the project repository. Follow the instructions in the project README to securely configure your Habitica API credentials (User ID and API Token) and the GitHub Personal Access Token (PAT) for GitHub Actions auto-push as environment variables or secrets.
(Note: This article was originally written in Chinese and translated to English by AI. Please excuse any imperfections in expression.)